X-ray diffractometers are designed for obtaining the ultimate quality diffraction data, combined with ease of use and flexibility to quickly switch to different applications.
In materials research, the scientist has many analytical questions related to the chemical composition and crystalline constitution of materials. X-ray diffraction (XRD) is the only laboratory technique that non-destructively and accurately obtains information such as chemical composition, crystal structure, crystallite size, lattice strain, preferred orientation and layer thickness. Materials researchers therefore use XRD to analyze a wide range of materials, from powders to solids, thin films and nanomaterials.
Many materials are made up of tiny crystallites. The chemical composition and structural type of these crystals is called their 'phase'. Materials can be single phase or multiphase mixtures and may contain crystalline and non-crystalline components. In an X-ray diffractometer, different crystalline phases give different diffraction patterns. Phase identification can be performed by comparing X-ray diffraction patterns obtained from unknown samples to patterns in reference databases. This process is like matching fingerprints in a crime scene investigation. The most comprehensive compound database is maintained by ICDD (International Center of Diffraction Data). You can also build a reference database from measured pure-phase diffraction patterns, or from patterns published in the scientific literature or from your own measurements. The relative strengths of the patterns from different phases in a multiphase mixture is used to determine the full composition of a sample.
Principles of X-ray Diffraction
X-Ray Diffraction is the result of constructive interference between X-rays and a crystalline sample. The wavelength of the X-rays used is of the same order of magnitude of the distance between the atoms in a crystalline lattice. This gives rise to a diffraction pattern that can be analysed in a number of ways, the most popular being applying the famous Bragg’s Law (nλ=2d sin θ) which is used in the measurement of crystals and their phases.
Single Crystal X-ray Structure Determination
Optical screening is the first and the most important step for sorting suitable for X-ray structure determination single crystal. Polarization Microscope is the most convenient tool for analyzing a quality and size of crystals. In most cases, single crystal has to be at least 0.1 mm in all three dimensions( if the substance has heavy atoms) or 0.2 (only light atoms as C, H, O, N, F). Normally, a good single crystal is well-shaped with visible planar faces. If the crystal is optically transparent it is possible to use polarized light to find all impurities, defects or twinning problem. It should be mentioned, that passing this stage of testing can not guarantee the data suitable for successful structure solution. However, at this point we can definitely sort out the samples which are not suitable for analysis in principle.
Rotation Photo is required for analyzing scattering capacity of a sample. To obtain rotation photo crystal rotates in a X-ray beam. Liquid, powder and single crystal produce absolutely different rotation patterns , therefore it is possible to sort out all non- single crystalline samples and weak diffracting crystals.
Cell parameters determination can be done only for single crystal. During the routine about 25 frames in three perpendicular directions of reciprocal space should be collected and positions of reflection have to be analyzed. The cell parameters in first approximation are the metric values for each particular substance ( to be more correct, for each crystal modification of substance, as many of individual substances can crystallize in two or more polymorphic modifications). Analyzing the profiles of reflections it is possible to check quality of single crystal. This stage is very important for twinned samples as some kinds of twins give excellent rotation photos, but can not be used for X-ray structure determination.
Data Collection is automatic routine to file positions and intensities of reflections in reciprocal space. The standard procedure is to collect the full-sphere data for better redundancy and absorption correction. However, for high-symmetry crystals and unstable crystals it is possible to collect hemi-sphere data. The duration of full-sphere data collection vary from 9 hours to some days depending on the "scattering power" of a sample
The laboratory uses almost exclusively SHELXTL PLUS V4.21 for structure solution and refinement. SHELXTL PLUS is a commercial version, distributed by Bruker-AXS, of George Sheldrick's SHELX-76 and SHELX-86 solution and refinement programs. Refinement using SHELXL-93 is also available. SHELXTL PLUS includes routines for processing of collected intensity data. It also includes routines for the production of tables and figures for publication.
Powder Pattern Analysis Software:
For analysis of powder patterns obtained from the Scintag, the Diffraction Management Software (DMS) distributed by Scintag has a number of routines in it for background correction and peak searching. The peak search routines try to match the relevant phases based on the International Center for Diffraction Data's PDF-1 database. Currently the laboratory has up to Set 42 of the JCPDS database available.
The DMS software also has routines for Rocking Curve analysis and some crystallographic routines.
All solution software and computer time on the Windows XP cluster are available to the certified users. Data sets may be collected and processed on the users own systems using the software of their choice.
Relationship between crystalline structure and X-ray data
Peak positions
Using Bragg's Law, the peak positions can be theoretically calculated.

For a cubic unit cell:
d = ![]() ,
,
where N = h2 + k2 + l2 and a is the cell parameter.
(More complex relationships for less symmetrical cells are given in most standard text books)
So the measured value 2θ can be related to the cell parameters.
In the earlier video peak was observed at about 44.4. Knowing the wavelength, 1.54Å, and using Bragg's Law gives a d-spacing of ~2.04 Å. Some additional information is required to obtain lattice parameters from this d-spacing. Knowing that LiF has a cubic structure with a unit cell ~4.03, means that this reflection must be (002) (which is the same as (200) and (020)).
Peak intensities
The structure factor, Fhkl, of a reflection, hkl, is dependent on the type of atoms and their positions (x, y, z) in the unit cell.

fi is the scattering factor for atom i and is related to its atomic number.
The intensity of a peak I hkl is given by:

The proportionality includes the multiplicity for that family of reflections and other geometrical factors.
Differences in intensity do relate to changes in chemistry (scattering factor). However, most commonly for multiphase samples, changes in intensities are related to the amount of each phase present in the sample. Suitable calibration factors are required to perform quantitative phase analysis.
Peak widths
The peak width β in radians (often measured as full width at half maximum, FWHM) is inversely proportional to the crystallite size Lhkl perpendicular to h k l plane

(Whilst small crystals are the most common cause of line broadening but other defects can also cause peak widths to increase.)
How does XRD Instrumentation work?
An X-ray instrument contains three main items: an X-ray source, a sample holder and an XRD detector.
The X-rays produced by the source illuminate the sample. It is then diffracted by the sample phase and enters the detector. By moving the tube or sample and detector to change the diffraction angle (2θ, the angle between the incident and diffracted beams), the intensity is measured, and diffraction data are recorded. Depending on the geometry of the diffractometer and the type of sample, the angle between the incident beam and the sample can be either fixed or variable and is usually paired with the diffracted beam angle.
How the Technique Works
X-ray diffraction is a common technique that determine a sample's composition or crystalline structure. For larger crystals such as macromolecules and inorganic compounds, it can be used to determine the structure of atoms within the sample. If the crystal size is too small, it can determine sample composition, crystallinity, and phase purity. This technique sends x-ray beams through it. X-ray beams are chosen because their wavelength is similar to the spacing between atoms in the sample, so the angle of diffraction will be affected by the spacing of the atoms in the molecule, as opposed to using much larger wavelengths, which would be unaltered by the spacing between atoms. The x-rays then pass through the sample, “bouncing” off of the atoms in the structure, and changing the direction of the beam at some different angle, theta, from the original beam. This is the angle of diffraction. Some of these diffracted beams cancel each other out, but if the beams have similar wavelengths, then constructive interference occurs. Constructive interference is when the x-ray beams that are whole number integers of the same wavelength add together to create a new beam with a higher amplitude. The greater amplitude of the wave translates into a greater signal for this specific angle of diffraction. The angle of diffraction can then be used to determine the difference between atomic planes using Bragg’s law, where lambda is the wavelength added, theta is the angle of diffraction, and d is the distance between atomic planes. The distance between atomic plates can then be used to determine composition or crystalline structure.
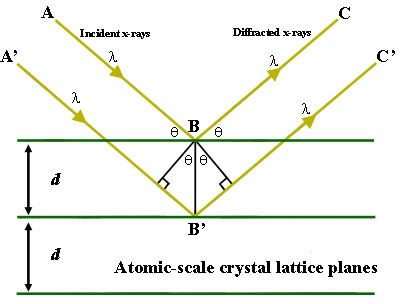
Figure 1. Bragg's Law reflection. The diffracted X-rays exhibit constructive interference when the distance between paths ABC and A'B'C' differs by an integer number of wavelengths (λ).
Applications of Bragg's Law.
- In X-ray diffraction (XRD) the interplanar spacing (d-spacing) of a crystal is used for identification and characterization purposes. In this case, the wavelength of the incident X-ray is known and measurement is made of the incident angle (Θ) at which constructive interference occurs. Solving Bragg's Equation gives the d-spacing between the crystal lattice planes of atoms that produce the constructive interference. A given unknown crystal is expected to have many rational planes of atoms in its structure; therefore, the collection of "reflections" of all the planes can be used to uniquely identify an unknown crystal. In general, crystals with high symmetry (e.g. isometric system) tend to have relatively few atomic planes, whereas crystals with low symmetry (in the triclinic or monoclinic systems) tend to have a large number of possible atomic planes in their structures.
- In the case of wavelength dispersive spectrometry (WDS) or X-ray fluorescence spectroscopy (XRF), crystals of known d-spacings are used as analyzing crystals in the spectrometer. Because the position of the sample and the detector is fixed in these applications, the angular position of the reflecting crystal is changed in accordance with Bragg's Law so that a particular wavelength of interest can be directed to a detector for quantitative analysis. Every element in the Periodic Table has a discrete energy difference between the orbital "shells" (e.g. K, L, M), such that every element will produce X-rays of a fixed wavelength. Therefore, by using a spectrometer crystal (with fixed d-spacing of the crystal) and positioning the crystal at a unique and fixed angle (Θ), it is possible to detect and quantify elements of interest based on the characteristic X-ray wavelengths produced by each element.
Applications of XRD
Many researchers, in industrial as well as in scientific laboratories, rely on X-ray diffraction (XRD) as a tool to develop new materials or to improve production efficiency. Innovations in X-ray diffraction closely follow the research on new materials, such as in semiconductor technologies or pharmaceutical investigations. Industrial research is directed toward the ever-increasing speed and efficiency of production processes. Fully automated X-ray diffraction analyses in mining and building materials production sites result in more cost-effective solutions for production control.
The main uses of X-ray diffraction are:
Qualitative and quantitative phase analysis of pure substances and mixtures. The most common method for phase analysis is often called 'X-ray powder diffraction' (XRPD).
- Analysis of phase changes under other special conditions such as temperature, humidity and applied pressure (non-ambient studies).
- Analysis of physical properties such as crystallite size (diameter), crystal orientation, and residual stress, which together are called the ‘microstructure’ of polycrystalline materials.
- Many of these techniques can also be used for polycrystalline layered materials such as coatings and thin films using a method called grazing incidence XRD (GIXRD). Studies of small areas in polycrystalline materials employ a method called microdiffraction.
Other X-ray diffraction techniques for materials that are not polycrystalline (for example single crystal semiconductor wafers or epitaxial layers) include high-resolution analysis of heteroepitaxial layers (HR-XRD) the analysis of which makes use of both Bragg’s Law and dynamical diffraction theory.
Advantages of XRD
XRD is rather fast (typically below 20 minutes) and is often the most accurate and reliable technique for the unambiguous identification of unknown materials. Sample preparation is minimal which is a reason why this technique is so popular and is suitable for use both in industrial process applications and in materials research. With the right analytical software, data analysis can be quite straightforward and for industrial processes, it can be even automated so that in QC applications the operator does not need to be an XRD expert.
X-ray scattering
Other methods that study the non-crystalline components of a material using various X-ray scattering methods, include Grazing incidence small-angle X-ray scattering (GISAXS), Small-angle X-ray scattering (SAXS), Total scattering (also called Pair Distribution Function (PDF) analysis), X-ray reflectometry (XRR). Each method has its own algorithm for data analysis, based on fundamental scattering theory.
How to interpret the data
The result of X-ray diffraction plots the intensity of the signal for various angles of diffraction at their respective two theta positions. The two theta positions correspond to a certain spacing between the crystals or atoms in the samples, determined by the angle of diffraction from the incident x-ray beam sent into the sample. The intensity of the peaks is related to the amount of molecules in that phase or with that spacing. The greater the intensity of the peak, the greater the amount of crystals or molecules with that distinct spacing.
The width of the peaks is inversely proportional to the crystal size. A thinner peak corresponds to a bigger crystal. A broader peak means that there may be a smaller crystal, defect in the crystalline structure, or that the sample might be amorphous in nature, a solid lacking perfect crystallinity. For smaller samples, the patterns determined using XRD analysis can be used to determine a sample’s composition. There is a large database of elements, compounds, and minerals that contain the diffraction patterns for elements, compounds, and minerals. The pattern for an unknown compound can be compared to the literature and experimentally determined values to verify the identity of an element, matching both the location, width, and relative heights of the diffraction patterns.
No comments:
Post a Comment